데이터프레임은 2차원 배열의 행과 열로 구성되어져 있다. 대부분의 사람들이 알고 있는 마이크로소프트사의 EXCEL, SQL Table 등을 생각하면 데이터프레임을 쉽게 이해할 수 있다. 판다스에서 가장 많이 사용되는 객체이며, 실제 파이썬을 활용한 데이터 분석을 하고 싶다면 필수적으로 알아야 하는 내용이다. 기본적으로 Python은 행렬 연산에 최적화된 언어라고 할 수 있지만, 판다스 라이브러리는 R의 데이터프레임에서 유래했다고 알려져 있다. 

[그림 1-1] 엑셀의 테이블 예시


여기서 잠깐! 초급자 또는 입문자들이 가장 궁금해하는 것 중의 하나가 R과 Python에 대한 비교가 아닐까 싶다. 통계/컴공 비전공자인 필자가 경험적으로 말씀 드리면 프로그래밍 기초가 전혀 없는 분들 중, 엑셀보다 빠른 데이터 전처리와 간단한 그래프를 그리는 것이 주목적이라면 여전히 R의 데이터프레임은 강력한 무기다. 간단하게 비교를 하자면, R의 대부분은 패키지는 데이터프레임이 기본 객체라고 봐도 무방하다. 그러나 파이썬은 웹개발이 주 언어이기 때문에 쉽게 접근하기가 힘들다. 인덱스, 딕셔너리, 행렬 등 매우 다양한 객체가 존재하기 때문에 이에 대한 인식은 알고서 출발해야 한다. 이 부분 때문에 조금 힘들고 난해할 수 있다. 그러나 데이터를 활용하여 프로그램을 개발하고 싶다면 이 때에는 Python이 가장 강력한 무기가 될 수 있다.


다시 본론으로 돌아오면, 아래 그림에서 설명하는 것처럼, 여러개의 시리즈들이 한데 모여서 데이터프레임을 이루는 구조가 데이터프레임이라고 할 수 있다.  

[그림 1-2] 시리즈와 데이터프레임 구조

시리즈가 모여서 데이터프레임이 만들어진다고 보면 더 좋을 듯 하다. 이 때, 데이터프레임의 열은 각각 시리즈의 객체이다. 우선, 판다스를 활용하여 간단하게 데이터프레임을 만들어 본다.


1. 딕셔너리에서 데이터프레임으로의 변환

딕셔너리에서 데이터프레임으로 변환하도록 한다. 아래 샘플코드를 확인해보자. 

dic_data = {'country': ['벨기에', '인도', '브라질'],
'capital': ['브뤼셀', '뉴델리', '브라질리아'],
'population': [11190846, 1303171035, 207847528]}
df = pd.DataFrame(dic_data)
print(df)
country capital population
0 벨기에 브뤼셀 11190846
1 인도 뉴델리 1303171035
2 브라질 브라질리아 207847528

'country', 'capital', 'population'은 열이름과 관련이 있는 것을 볼 수가 있다. 또한 자동적으로 행 인덱스가 0부터 생성됨을 볼수가 있다.

2. 시리즈에서 데이터프레임으로의 변환

이번에는 시리즈에서 데이터프레임으로 변환한다. 아래 샘플코드를 확인해보자.

series = {'one': pd.Series([1., 2., 3.], index=['a', 'b', 'c']),
'two': pd.Series([1., 2., 3., 4.], index=['a', 'b', 'c', 'd'])}
df = pd.DataFrame(series)
print(df)
one two
a 1.0 1.0
b 2.0 2.0
c 3.0 3.0
d NaN 4.0

한가지 특이점은 각 컬럼마다 값이 달라도 에러가 발생하지는 않고, 다만 NaN이 작성되는 것을 볼 수가 있다.

3. ndArrays & Lists에서 데이터프레임으로의 변환

파이썬은 행렬과 리스트로 작성되는 코드가 많다. ndArrays에서 데이터프레임으로 변환 시, 특정 열(=column)에 결측치가 있으면 에러가 반환된다. 먼저 정상적인 코드를 확인한다.

ndArrays = {'one': [1., 2., 3., 4.],
'two': [4., 3., 2., 1.]}
pd.DataFrame(ndArrays)
one two
0 1.0 4.0
1 2.0 3.0
2 3.0 2.0
3 4.0 1.0

다음은 결측치가 발생한 코드를 확인한다. 아래코드에서 보는 것처럼 ValueError: arrays must all be same length 에러가 발생하는 것을 확인할 수 있다. (실제 에러코드가 발생하는지 확인해본다!)

ndArrays = {'one': [1., 2., 3., 4.],
'two': [4., 3., 2.]}
pd.DataFrame(ndArrays)

[그림 1-3] ndArrays에서 데이터프레임 변환 에러 발생 예시

위 코드에서 알 수 있는 것처럼, 딕셔너리 또는 시리즈 객체에서 데이터프레임으로 변환하는 경우 NaN을 반환하지만 데이터프레임으로 변환이 가능했다. 그러나 ndArrays의 경우 데이터프레임 객체 생성이 되지 않기 때문에, 데이터프레임으로 변환할 경우, 해당 객체가 ndArrays인지 우선 확인이 필요하다. 


다음 시간에는 생성된 데이터프레임에서 행과 열을 추출, 삭제, 추가와 관련된 내용을 담을 예정이다. 

Intro

MongoDB is a NoSQL database program using JSON type of documents with schemas. It’s open source cross-platform database. MongoDB is the representative NoSQL database engine. To me, I’ve started to learn Python for some reasons. One of them, for me, is that I want to insert webCrawling datasets including text data, image url, and so on. to NoSQL database.

MongDB Installation

I highly recommend users to use mongoDB atlas. Since Cloud rapidly dominates over IT industry, it’s better to practice a good cloud product like mongodb atlas cloud. It’s free to use it connecting to major cloud service agencies, AWS, GCP, Azure. The details are followed link: https://www.mongodb.com/cloud/atlas

Note - Network Access

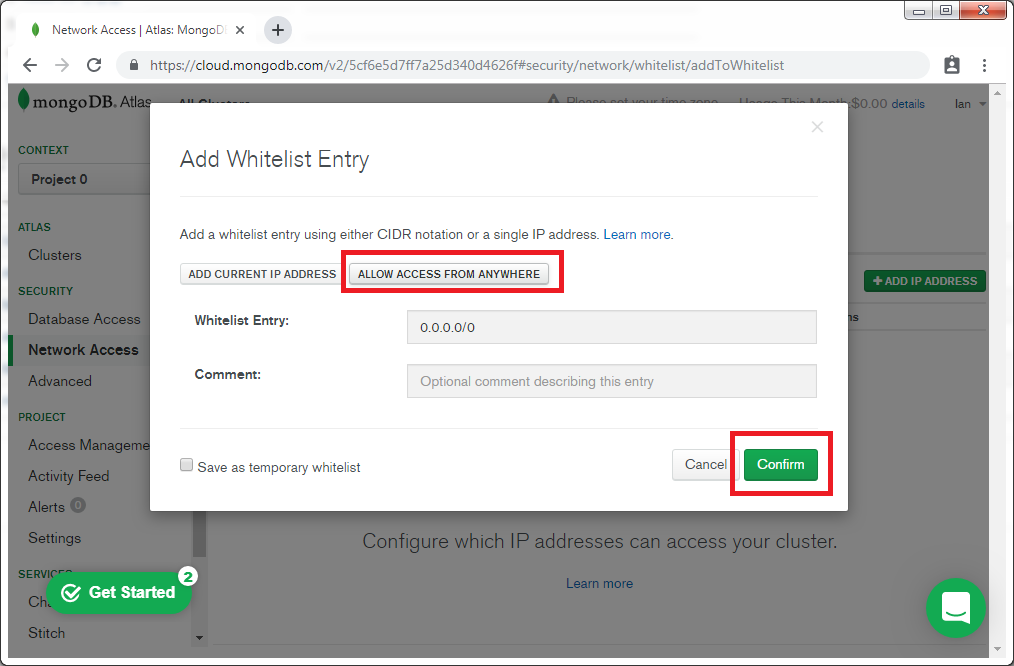
Following instructions, it’s not much difficult to build mongoDB cluster. But, when setting Network Access up, it’s a bit confused where to click. For educational purpose please click ALLOW ACCESS FROM ANYWHERE for your sake.

By clicking, users are freely access to mongoDB in cloud.

Python Connecting to MongoDB Cluster

Many ways to connect in different languages. Here, fortunately, for python users, this platform provides sample code.

Now, it’s time to code in python.

Python module Installation

In Python, type below code and install on terminal.

$ pip install pymongo
$ pip install dnspython
$ pip install motor

If using python3, then use pip3 instead of pip

The details are explained at https://pypi.org/project/pymongo/

Via pymongo.MongoClient("your_uri"), users are able to reach mongoDB.

Error Handling 1 - dnspython

To me, the most difficult one was dealing with dnspython. When facing with the error dnspython, then please find solution Driver Compatibility

Erros Handling - Python Error Certificate Verify Failed

When trying to execute get data with query, then Certificate Verify Failed message may pop up. Then kindly visit How To Fix Python Error Certificate Verify Failed: Unable To Get Local Issuer Certificate In Mac OS

import pymongo
import dns
import pprint
import motor
url_path = "mongodb+srv://<user>:<password>@tafuncluster-rmc7j.gcp.mongodb.net/test?retryWrites=true&w=majority"
client = pymongo.MongoClient(url_path)
db = client['sample_dataset_R']
collection = db['iris']
pprint.pprint(collection.find_one())
{'Petal_Length': 1.4,
'Petal_Width': 0.2,
'Sepal_Length': 5.1,
'Sepal_Width': 3.5,
'Species': 'setosa',
'_id': ObjectId('5db94dbfe6188c5426265283')}

From MongoDB to Pandas

The major work of data scientist or data analyst is to get data as DataFrame not JSON type. So, this is another important to convert JSON to DataFrame using Pandas. Let's try sample code below. Let's print again.

pprint.pprint(collection.find_one())
{'Petal_Length': 1.4,
'Petal_Width': 0.2,
'Sepal_Length': 5.1,
'Sepal_Width': 3.5,
'Species': 'setosa',
'_id': ObjectId('5db94dbfe6188c5426265283')}

At this moment, we don't need to get _id. So, we will exclude the column.

import pandas as pd
exclude_column = {'_id': False}
mong_data = list(collection.find({}, projection=exclude_column))
iris = pd.DataFrame(mong_data)
print(iris)
Sepal_Length Sepal_Width Petal_Length Petal_Width Species
0 5.1 3.5 1.4 0.2 setosa
1 4.9 3.0 1.4 0.2 setosa
2 4.7 3.2 1.3 0.2 setosa
3 4.6 3.1 1.5 0.2 setosa
4 5.0 3.6 1.4 0.2 setosa
.. ... ... ... ... ...
595 6.7 3.0 5.2 2.3 virginica
596 6.3 2.5 5.0 1.9 virginica
597 6.5 3.0 5.2 2.0 virginica
598 6.2 3.4 5.4 2.3 virginica
599 5.9 3.0 5.1 1.8 virginica
[600 rows x 5 columns]
  • why we need list? After the command line, mong_data is stored in json format

  • From JSON format, we can converting json to pandas dataframe.

Creating Database and Collection

MongoDB will create very quickly and automatically if it does not exist, and make a connection to it. Let's create a database called my1stdatabase

import pymongo
my1stdatabase = client['my1stdatabase']
my1stcollection = my1stdatabase['my1stcollection']

This two line codes are big enough creating database and collection

Insert iris data into Collection

To insert data into Collection, it's not quite difficult to do it. We will use iris data already imported.

my1stcollection.insert_many(iris.to_dict('records'))
<pymongo.results.InsertManyResult at 0x116afc280>

Instead of iris, my1stcollection named is shown at mongodb cloud.

Conclusion

In this post, you have learnt that you can set up a mongoDB server very quickly, and that mongoDB is a breeze!

I like Cloud. Cloud is very powerful when working with others. As Data Scientist, building infrastructure is indeed horrible. Although docker is powerful, but it frustrates me when needed to study network, bridge, etc concepts. So, I gave up. I turned my goal to find a good solution related with cloud, and I found mongodb cloud. Yes, still needs to study more about MongoDB. For sure, I am able to be a big fan of mongoDB which is able to import and export unstructured data like img url, text data, etc with relational data.


I wanted to stick to a simple example, and I’m sure that it will already be very useful to you. In future posts, we’ll see how to access the server from a remote machine, and how to fill and read the database asynchronously, for an interactive display with bokeh.


For R Users, Please click my another post [http://rpubs.com/Evan_Jung/r_mongodb]

Intro


파이썬의 수많은 라이브러리 중, 엑셀데이터를 수집하고 정리하는 데 최적화된 도구가 판다스 라이브러리라고 볼 수 있다. 판다스를 배우면 데이터과학의 80~90% 업무를 처리할 수 있고, 데이터과학자에게 필요한 기본적이면서도 아주 중요한 도구를 갖출 수 있다. 데이터베이스 관점에서 접근하면, 관계형 데이터베이스를 보다 쉽고 직관적으로 처리하는데 도움을 준다. 판다스가 처리할 수 있는 데이터는 다음과 같다.

  • SQL 테이블 또는 Excel 스프레드 시트에서와 같이 유형이 다른 열이있는 테이블 형식 데이터

  • 순서에 상관없이 정렬된 시계열 데이터

  • 행과 열 라벨이 있는 임의의 행렬 데이터

  • 통계 데이터

판다스의 두 가지 기본 데이터 구조인 Series(1차원) 및 DataFrame (2차원)은 재무, 통계, 사회 과학 및 여러 엔지니어링 분야에서 대부분의 데이터를 처리하는데 적합하다. 판다스는 파이썬의 NumPy를 기반으로 구축되었으며 과학 컴퓨팅 환경 내에서 다른 많은 타사 라이브러리와 잘 통합되도록 설계되었다.


1차원 배열의 시리즈


Series는 모든 데이터 유형 (정수, 문자열, 부동 소수점 숫자, Python 객체 등)을 보유 할 수있는 1차원 레이블이 지정된 배열이다. 이때, 축 레이블을 총칭하여 인덱스라고 부른다.


[그림 1-1] 시리즈와 데이터프레임 구조

<출처: https://www.kdnuggets.com/2017/01/pandas-cheat-sheet.html>

시리즈 만들기


시리즈를 만드는 방법은 다음과 같다.

s = pd.Series(data, index=index)


보통 딕셔너리와 시리즈의 구조가 비슷하기 때문에 딕셔너리를 시리즈로 변환하는 방법을 사용하기는 하지만, 엄밀히 말하면 data가 더 적정한 표현이다. 다만, data에 용어 정의는 조금 더 숙지할 필요가 있다.

여기에서 data는 크게 3가지를 의미한다.

  • a Python Dictionary

  • an ndarray

  • a scalar value

A Python Dictionary


import pandas as pd
d = {'b': 1, 'a': 0, 'c': 2}
pd.Series(d)
b    1
a    0
c    2
dtype: int64

여기서 주의해야 할 점이 있다. 만약에 index가 알파벳 순인 ['a', 'b', 'c'] 형태로 정렬이 되었다면 판다스와 파이썬의 버전을 확인하기를 바란다. 독자의 편의상 판다스 메뉴얼 원어를 그대로 인용하기로 한다.

Note: When the data is a dict, and an index is not passed, the Series index will be ordered by the dict’s insertion order, if you’re using Python version >= 3.6 and Pandas version >= 0.23.
If you’re using Python < 3.6 or Pandas < 0.23, and an index is not passed, the Series index will be the lexically ordered list of dict keys.

다른 형태의 Series를 보도록 한다.

data = {'a': 0., 'b': 1., 'c': 2.}
pd.Series(data)
a    0.0
b    1.0
c    2.0
dtype: float64
pd.Series(data, index=['b', 'c', 'd', 'a'])
b    1.0
c    2.0
d    NaN
a    0.0
dtype: float64

Note: 저장된 시리즈 객체 data에 index인자와 함께 인덱스 d를 추가하였더니, NaN이라는 문자가 나타났는데, 이는 판다스에서 사용되는 결측치에 해당하는 일종의 표준어라 생각하면 된다.

An ndarray


ndarray는 NumPy에서 파생된 객체로써, 이때에는 인덱스와 ndarray가 같은 길이로 매칭되어야 하며, 만약에 매칭되는 인덱스가 없다면 자동으로 [0, ..., len(data) - 1] 형태로 생성될 것이다.

import numpy as np
data = np.random.randn(5)
s1 = pd.Series(data, index=['a', 'b', 'c', 'd', 'e'])
print(s1)
a    0.250122
b    0.952477
c   -0.225997
d    0.798407
e    0.979913
dtype: float64

index=['a', 'b', 'c', 'd', 'e']가 존재하기 때문에, 정확하게 a~e형태로 출력되는 것을 확인할 수 있다.

s2 = pd.Series(data)
print(s2)
0    0.250122
1    0.952477
2   -0.225997
3    0.798407
4    0.979913
dtype: float64

인덱스가 존재하지 않기 때문에 자동으로 숫자가 생성되었지만, 이 때 특이한점은 인덱스가 0부터 시작한다는 것이다.

A scalar value


만약에 데이터가 scalar value (like 5)라면 반드시 인덱스가 존재해야 한다. 또한, 이때 scalar value는 인덱스의 길이 만큼 반복된다.

pd.Series(5., index=['a', 'b', 'c', 'd', 'e'])
a    5.0
b    5.0
c    5.0
d    5.0
e    5.0
dtype: float64

여기서 잠깐! Pandas와 pd의 차이는?

더보기

만약에서 파이썬 파일(확장자.py)에서 판다스를 활용하려면 import 명령어를 사용한다. 앞의 예제에서 import pandas as pd or import numpy as np와 같은 형식을 입력했는데, 이는 약어를 의미한다. 만약에 as pd와 같은 약어를 사용하지 않는다면 pd.Series() 대신, pandas.Series()라고 사용을 해야 한다. 그런데, 실무에서는 약칭을 자주 사용하기 때문에 본 책에서도 약어 위주로 소스 코드를 입력하려고 한다.


원소 선택 - 배열과 같은 Series


Series는 ndarray와 매우 유사하게 작동하며 대부분의 NumPy 함수 유사한 인자를 가지고 있다. 그런데, 슬라이싱과 같은 작업을 할 때에는 인덱스도 같이 슬라이스를 해야 한다. 아래의 코드들은 원소 선택과 연관이 있기 때문에 주의 깊게 볼 필요가 있다.

s[0]
-0.8691605170316093
s[:2]
a   -0.869161
b    2.064238
dtype: float64
s[s > s.median()]
b    2.064238
c    1.011246
dtype: float64
s[[4, 3, 1]]
e   -0.116053
d   -0.524454
b    2.064238
dtype: float64
np.exp(s)
a    0.419303
b    7.879294
c    2.749024
d    0.591878
e    0.890428
dtype: float64

NumPy의 배열처럼, 판다스의 Series도 dtype를 가지고 있다.

s.dtype
dtype('float64')

만약에 Series를 지원하는 행렬을 사용하고 싶다면, 이 때에는 Series.array를 사용한다.

s.array
[ -0.8691605170316093,    2.064238263144146,   1.0112458349198605,
    -0.52445402723024, -0.11605276365619435]
Length: 5, dtype: float64

인덱스없이 일부 작업을 수행해야하는 경우 배열로 접근하는 것은 매우 유용 할 수 있다. 만약에 Series.array가 아닌 NumPy의 ndarray로 사용해야 하는 경우에는 Series.to_numpy() 한다.

s.to_numpy()
array([-0.86916052,  2.06423826,  1.01124583, -0.52445403, -0.11605276])

원소 선택 - 딕셔너리와 같은 Series

배열에서 특정 값(value)을 가져올 때는 보통 배열의 숫자를 통해서 값을 조회했습니다만, 인덱스를 활용하여 문자를 통해 값을 조회 한다. 객체 s에서 ['a']를 입력하여 값을 가져오도록 한다.

s['a']
-0.8691605170316093

이번에는 새로운 값과 인덱스를 생성한다. 

s['e'] = 12.
print(s)
a    -0.869161
b     2.064238
c     1.011246
d    -0.524454
e    12.000000
dtype: float64
'e' in s # True
'f' in s # False

만약에 특정 라벨이 포함되지 않았다면, 예외가 발생할 것이다. 'f'를 대입하여 실행해본다. 

s['f']
KeyError: 'f'

이 때, `KeyError: 'f'`라는 에러가 발생하는 것을 확인할 수 있다. `get()` 사용하면, 해당하는 값이 반환이 되지 않거나 또는 `None`을 반환한다.

s.get('f') # Nothing displayed
print(s.get('f')) # None

위 두개의 코드를 각각 실행 한 후 결과값을 비교해 보도록 한다. 


- End of Document - 

Count plots

In this exercise, we'll return to exploring our dataset that contains the responses to a survey sent out to young people. We might suspect that young people spend a lot of time on the internet, but how much do they report using the internet each day? Let's use a count plot to break down the number of survey responses in each category and then explore whether it changes based on age.


이번 예제는 설문 조사에 대한 젋은층 응답을 포함하는 데이터 세트를 살펴 봅니다. 젊은 사람들이 인터넷에서 많은 시간을 보냈다고 의심 할 수도 있지만, 실제로 젋은 사람들이 매일 인터넷 사용에 관한 보고는 실제로 확인할 필요가 있습니다. 이번에 카운트 플롯(Count plots)을 사용하여 각 카테고리의 설문 응답 수를 분석 한 다음 연령에 따라 설문 응답이 어떻게 변하는 지 여부를 알아 봅니다.


As a reminder, to create a count plot, we'll use the catplot() function and specify the name of the categorical variable to count (x=____), the Pandas DataFrame to use (data=____), and the type of plot (kind="count").


다시 말해 카운트 플롯을 만들려면 catplot() 함수를 사용하고 계산할 범주 변수의 이름 (x = ____), 사용할 팬더 데이터 프레임 (data = ____) 및 유형을 지정합니다. plot (kind = "count").


Seaborn has been imported as sns and matplotlib.pyplot has been imported as plt.


Seaborn은 sn으로 가져오고 matplotlib.pyplot은 plt로 가져 왔습니다.

# Import Matplotlib and Seaborn
import matplotlib.pyplot as plt
import seaborn as sns
import pandas as pd
url = 'https://assets.datacamp.com/production/repositories/3996/datasets/ab13162732ae9ca1a9a27e2efd3da923ed6a4e7b/young-people-survey-responses.csv'
survey_data = pd.read_csv(url)
print(survey_data)
Unnamed: 0 Music Techno Movies History Mathematics Pets Spiders \
0 0 5.0 1.0 5.0 1.0 3.0 4.0 1.0
1 1 4.0 1.0 5.0 1.0 5.0 5.0 1.0
2 2 5.0 1.0 5.0 1.0 5.0 5.0 1.0
3 3 5.0 2.0 5.0 4.0 4.0 1.0 5.0
4 4 5.0 2.0 5.0 3.0 2.0 1.0 1.0
5 5 5.0 1.0 5.0 5.0 2.0 2.0 1.0
6 6 5.0 5.0 4.0 3.0 1.0 5.0 1.0
7 7 5.0 3.0 5.0 5.0 1.0 5.0 1.0
8 8 5.0 1.0 5.0 3.0 1.0 1.0 5.0
9 9 5.0 1.0 5.0 3.0 3.0 2.0 3.0
10 10 5.0 4.0 5.0 3.0 2.0 5.0 2.0
11 11 5.0 1.0 5.0 2.0 1.0 1.0 5.0
12 12 5.0 1.0 5.0 4.0 1.0 2.0 1.0
13 13 5.0 1.0 5.0 2.0 1.0 5.0 3.0
14 14 5.0 1.0 4.0 2.0 1.0 5.0 2.0
15 15 1.0 1.0 5.0 5.0 3.0 1.0 1.0
16 16 5.0 4.0 5.0 1.0 1.0 5.0 5.0
17 17 5.0 1.0 5.0 3.0 1.0 5.0 4.0
18 18 5.0 4.0 5.0 3.0 5.0 4.0 1.0
19 19 5.0 3.0 3.0 2.0 3.0 1.0 4.0
20 20 5.0 3.0 5.0 5.0 2.0 3.0 2.0
21 21 5.0 1.0 5.0 4.0 3.0 5.0 1.0
22 22 5.0 3.0 5.0 3.0 1.0 5.0 5.0
23 23 5.0 1.0 5.0 2.0 2.0 5.0 3.0
24 24 5.0 3.0 5.0 4.0 2.0 3.0 5.0
25 25 5.0 2.0 5.0 2.0 3.0 3.0 5.0
26 26 5.0 2.0 5.0 3.0 2.0 5.0 1.0
27 27 4.0 4.0 5.0 2.0 1.0 5.0 5.0
28 28 5.0 3.0 5.0 5.0 1.0 3.0 4.0
29 29 5.0 3.0 5.0 5.0 2.0 2.0 5.0
... ... ... ... ... ... ... ... ...
980 980 5.0 1.0 5.0 5.0 1.0 3.0 5.0
981 981 5.0 1.0 5.0 5.0 1.0 1.0 5.0
982 982 5.0 1.0 4.0 1.0 3.0 4.0 1.0
983 983 5.0 2.0 5.0 2.0 1.0 4.0 5.0
984 984 5.0 1.0 4.0 1.0 1.0 4.0 5.0
985 985 5.0 1.0 5.0 4.0 1.0 2.0 4.0
986 986 4.0 4.0 4.0 5.0 5.0 1.0 1.0
987 987 4.0 1.0 4.0 5.0 2.0 2.0 2.0
988 988 5.0 NaN 5.0 5.0 4.0 1.0 1.0
989 989 5.0 5.0 3.0 5.0 1.0 1.0 1.0
990 990 5.0 1.0 5.0 3.0 1.0 1.0 1.0
991 991 5.0 2.0 5.0 4.0 1.0 5.0 3.0
992 992 4.0 5.0 4.0 5.0 5.0 1.0 5.0
993 993 5.0 2.0 5.0 1.0 1.0 2.0 3.0
994 994 5.0 1.0 5.0 5.0 1.0 5.0 4.0
995 995 5.0 5.0 5.0 3.0 4.0 5.0 1.0
996 996 5.0 1.0 3.0 4.0 1.0 2.0 2.0
997 997 5.0 1.0 4.0 1.0 2.0 5.0 4.0
998 998 5.0 5.0 5.0 3.0 5.0 1.0 1.0
999 999 5.0 5.0 4.0 4.0 5.0 1.0 2.0
1000 1000 5.0 3.0 5.0 3.0 1.0 5.0 1.0
1001 1001 5.0 3.0 3.0 3.0 1.0 4.0 1.0
1002 1002 5.0 3.0 3.0 2.0 1.0 2.0 1.0
1003 1003 4.0 4.0 5.0 3.0 1.0 5.0 4.0
1004 1004 5.0 5.0 5.0 3.0 2.0 4.0 3.0
1005 1005 5.0 3.0 5.0 4.0 1.0 4.0 2.0
1006 1006 4.0 4.0 5.0 4.0 5.0 5.0 1.0
1007 1007 4.0 1.0 4.0 2.0 3.0 5.0 2.0
1008 1008 5.0 2.0 5.0 3.0 1.0 4.0 3.0
1009 1009 5.0 3.0 5.0 2.0 2.0 5.0 1.0
Loneliness Parents' advice Internet usage Finances Age \
0 3.0 4.0 few hours a day 3.0 20.0
1 2.0 2.0 few hours a day 3.0 19.0
2 5.0 3.0 few hours a day 2.0 20.0
3 5.0 2.0 most of the day 2.0 22.0
4 3.0 3.0 few hours a day 4.0 20.0
5 2.0 3.0 few hours a day 2.0 20.0
6 3.0 4.0 less than an hour a day 4.0 20.0
7 2.0 3.0 few hours a day 3.0 19.0
8 4.0 4.0 few hours a day 2.0 18.0
9 2.0 3.0 few hours a day 4.0 19.0
10 2.0 4.0 less than an hour a day 2.0 19.0
11 4.0 4.0 few hours a day 2.0 17.0
12 5.0 4.0 few hours a day 4.0 24.0
13 2.0 3.0 few hours a day 3.0 19.0
14 2.0 4.0 most of the day 5.0 22.0
15 4.0 4.0 few hours a day 3.0 18.0
16 2.0 3.0 few hours a day 3.0 19.0
17 4.0 1.0 few hours a day 1.0 20.0
18 4.0 3.0 few hours a day 4.0 18.0
19 2.0 2.0 few hours a day 2.0 18.0
20 2.0 3.0 few hours a day 2.0 20.0
21 4.0 3.0 few hours a day 2.0 24.0
22 3.0 3.0 few hours a day 5.0 22.0
23 3.0 2.0 few hours a day 2.0 20.0
24 4.0 4.0 few hours a day 3.0 19.0
25 2.0 4.0 few hours a day 2.0 20.0
26 4.0 5.0 few hours a day 5.0 22.0
27 3.0 4.0 few hours a day 3.0 19.0
28 3.0 3.0 few hours a day 3.0 20.0
29 3.0 3.0 few hours a day 4.0 19.0
... ... ... ... ... ...
980 2.0 4.0 less than an hour a day 1.0 18.0
981 4.0 2.0 most of the day 5.0 19.0
982 3.0 4.0 few hours a day 2.0 18.0
983 2.0 3.0 few hours a day 2.0 22.0
984 3.0 1.0 most of the day 4.0 21.0
985 3.0 1.0 few hours a day 5.0 20.0
986 3.0 3.0 few hours a day 1.0 19.0
987 4.0 2.0 few hours a day 3.0 20.0
988 5.0 3.0 few hours a day 1.0 19.0
989 5.0 3.0 most of the day 3.0 30.0
990 2.0 2.0 few hours a day 1.0 29.0
991 2.0 1.0 most of the day 3.0 21.0
992 3.0 3.0 most of the day 1.0 30.0
993 4.0 3.0 few hours a day 4.0 21.0
994 3.0 4.0 few hours a day 3.0 20.0
995 4.0 4.0 few hours a day 4.0 18.0
996 2.0 4.0 few hours a day 3.0 20.0
997 2.0 NaN less than an hour a day 3.0 19.0
998 2.0 3.0 few hours a day 4.0 28.0
999 3.0 3.0 few hours a day 3.0 19.0
1000 3.0 2.0 few hours a day 1.0 16.0
1001 2.0 2.0 few hours a day 2.0 18.0
1002 3.0 2.0 few hours a day 4.0 22.0
1003 3.0 4.0 few hours a day 3.0 20.0
1004 3.0 2.0 few hours a day 4.0 22.0
1005 4.0 4.0 few hours a day 3.0 20.0
1006 1.0 4.0 less than an hour a day 3.0 27.0
1007 4.0 4.0 most of the day 1.0 18.0
1008 3.0 3.0 most of the day 3.0 25.0
1009 3.0 3.0 few hours a day 5.0 21.0
Siblings Gender Village - town
0 1.0 female village
1 2.0 female city
2 2.0 female city
3 1.0 female city
4 1.0 female village
5 1.0 male city
6 1.0 female village
7 1.0 male city
8 1.0 female city
9 3.0 female city
10 2.0 female city
11 1.0 female city
12 10.0 female city
13 1.0 female city
14 1.0 female city
15 0.0 male city
16 2.0 female city
17 1.0 female village
18 2.0 male city
19 1.0 male city
20 1.0 male city
21 1.0 male city
22 1.0 female city
23 3.0 female city
24 1.0 female city
25 1.0 female city
26 1.0 female city
27 1.0 female city
28 2.0 male village
29 2.0 female village
... ... ... ...
980 2.0 female city
981 1.0 female village
982 2.0 male city
983 2.0 female village
984 1.0 female city
985 1.0 female city
986 3.0 female city
987 1.0 male city
988 0.0 male city
989 2.0 female village
990 1.0 male city
991 0.0 male city
992 1.0 male city
993 0.0 female city
994 0.0 female city
995 0.0 female city
996 0.0 male NaN
997 1.0 female NaN
998 1.0 male city
999 1.0 male city
1000 1.0 female city
1001 2.0 female city
1002 1.0 male city
1003 1.0 female city
1004 1.0 male city
1005 1.0 female city
1006 5.0 male village
1007 0.0 female city
1008 1.0 female city
1009 1.0 male village
[1010 rows x 16 columns]

Quesiton

  • Use sns.catplot() to create a count plot using the survey_data DataFrame with "Internet usage" on the x-axis.
# Change the orientation of the plot
sns.catplot(x="Internet usage", data=survey_data,
kind="count")
# Show plot
plt.show()

Question

  • Make the bars horizontal instead of vertical.
# Change the orientation of the plot
sns.catplot(y="Internet usage", data=survey_data,
kind="count")
# Show plot
plt.show()

Question

  • Create column subplots based on "Age Category", which separates respondents into those that are younger than 21 vs. 21 and older.
# Create Age Category column by condition
import numpy as np
survey_data['Age Category'] = np.where(survey_data['Age'] >= 21, "21+", "Less than 21")
print(survey_data[['Age', 'Age Category']].head())
Age Age Category
0 20.0 Less than 21
1 19.0 Less than 21
2 20.0 Less than 21
3 22.0 21+
4 20.0 Less than 21
# Create column subplots based on age category
sns.catplot(y="Internet usage", data=survey_data,
kind="count", col='Age Category')
# Show plot
plt.show()


All the Contents are from DataCamp

+ Recent posts