1. Intro

지금까지 배운 것은 데이터프레임으로 변환하는 내용이었다. 데이터프레임으로 변환한다는 뜻은 결과적으로 연구자 또는 분석 요건에 맞춰서 데이터를 가공할 줄 알아야 한다. Pandas를 배우는 궁극적인 목적이기도 하다. 


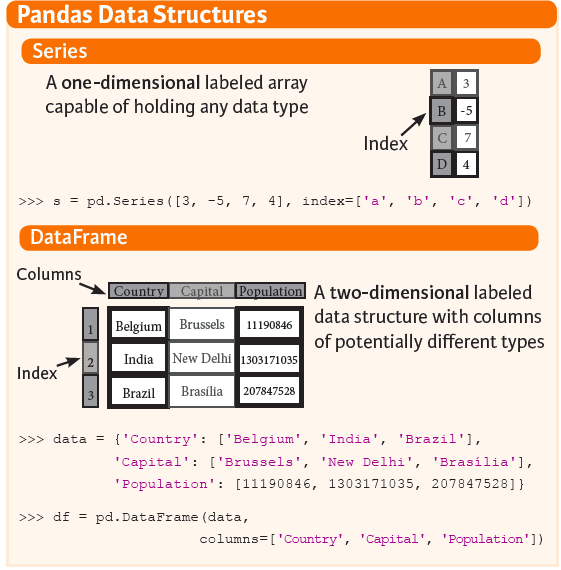
혹시 데이터프레임에 관한 기본 지식이 필요한 분들은 아래 글을 방문하시기를 바란다. 

https://chloevan.github.io/python/pandas/pandas_dataframe/


기본적으로 딕셔너리를 다뤘던 내용과 거의 유사하기 때문에 주의 깊게 살펴보기를 바란다. 
우선, 데이터프레임을 만들도록 하겠다. 

import pandas as pd
exam_dic = {'국어' : [80, 70, 90, 87], "영어" : [100, 80, 50, 90], 
            '수학' : [85, 75, 65, 100], "과학" : [89, 67, 90, 85]}

data = pd.DataFrame(exam_dic, index = ['Evan', 'Chloe', 'Alice', 'John'])

print(data)
       국어   영어   수학  과학
Evan   80  100   85  89
Chloe  70   80   75  67
Alice  90   50   65  90
John   87   90  100  85

2. 열 다루기

열을 다루는 방법은 여러가지가 있는데, 대표적으로 말하면 크게 3가지가 존재한다. 
- 열 선택(Selection)
- 열 추가(Addition)
- 열 삭제(Deletion)

이제 본격적으로 차례대로 하나씩 진행하도록 해본다.

2.1 열 선택

기본적으로 열을 선택할 때에는 data[' '] 열의 이름을 입력하거나 또는 dot (.) 를 활용한 방법(ex: data.열이름) 두 가지 방식이 있다. 이 때 주의해야 하는 것은 열 1개만 선택하면 시리즈로 반환한다. 


data['국어']
Evan     80
Chloe    70
Alice    90
John     87
Name: 국어, dtype: int64
data.국어
Evan     80
Chloe    70
Alice    90
John     87
Name: 국어, dtype: int64

만약 2개 이상의 열을 선택하고 싶다면 data[['열이름1', '열이름2', ..., '열이름N']]와 같은 형태로 지정하면 이번에는 시리즈 객체가 아닌 데이터프레임으로 반환한다. 


코드로 확인해보자.

data[['국어', '과학']]
       국어  과학
Evan   80  89
Chloe  70  67
Alice  90  90
John   87  85


2.2. 열 추가

열을 추가하는 것은 엑셀을 쉽게 떠올리면 매우 쉽다. 간단하게 문법을 소개하면 data['새로운 열 이름'] = 데이터 값 와 같으며, 이 때 데이터 값을 잘 다뤄야 한다. 우선 언어영역합계, 수리영역합계라는 열 이름을 추가하도록 하겠다.

data['언어영역합계'] = data['국어'] + data['영어']
print(data)
       국어   영어   수학  과학  언어영역합계
Evan   80  100   85  89     180
Chloe  70   80   75  67     150
Alice  90   50   65  90     140
John   87   90  100  85     177
data['수리영역합계'] = data['수학'] + data['과학']
print(data)
       국어   영어   수학  과학  언어영역합계  수리영역합계
Evan   80   100   85  89    180        174
Chloe  70    80   75  67    150        142
Alice  90    50   65  90    140        155
John   87    90  100  85    177        185

이번에는 수업태도점수를 모두 10점을 준다고 가정을 하고 일괄적으로 처리하도록 해보자. 코드는 다음과 같다.

data['수업태도점수'] = 10
print(data)
       국어   영어   수학  과학  언어영역합계  수리영역합계  수업태도점수
Evan   80    100    85   89  180       174        10
Chloe  70     80    75   67  150       142        10
Alice  90     50    65   90  140       155        10
John   87     90   100   85  177       185        10

2.3 열 삭제

열을 삭제하는 방법은 크게 3가지 방법이 있다. 
- del을 사용하는 방법
- pop을 사용하는 방법
- drop을 사용하는 방법

먼저 del을 사용하는 방법이다. 먼저 수업태도점수를 삭제한다.

del data['수업태도점수']
print(data)
       국어   영어   수학  과학  언어영역합계  수리영역합계
Evan   80    100   85  89    180       174
Chloe  70     80   75  67    150       142
Alice  90     50   65  90    140       155
John   87     90  100  85    177       185

다음은 pop을 사용하여 수리영역합계를 삭제한다.

data.pop('수리영역합계')
print(data)
       국어   영어   수학  과학  언어영역합계
Evan   80    100   85   89   180
Chloe  70     80   75   67   150
Alice  90     50   65   90   140
John   87     90  100   85   177

마지막으로 drop을 사용하여 언어영역합계를 삭제한다. 다만, 이 때는 axis=1과 inplace=True라는 옵션을 사용한다. 뜻은 data객체를 변경하여 열을 삭제한다는 뜻이다. 참고로 axis=0으로 설정할 경우 행 또는 인덱스 배열을 삭제한다는 뜻이다.

data.drop('언어영역합계', axis=1, inplace=True)
print(data)
       국어   영어   수학  과학
Evan   80    100   85  89
Chloe  70     80   75  67
Alice  90     50   65  90
John   87     90  100  85

지금까지 데이터프레임의 열(=Column)을 다루는 가장 기본적인 과정을 다루었다. 물론, 실무에서는 고급기술이 더 많이 사용되기는 하지만, 언제나 기초가 중요하기 때문에 기본적인 함수의 사용법에 대해 익히기를 바란다.


도움이 되었기를 바랍니다. 

데이터프레임은 2차원 배열의 행과 열로 구성되어져 있다. 대부분의 사람들이 알고 있는 마이크로소프트사의 EXCEL, SQL Table 등을 생각하면 데이터프레임을 쉽게 이해할 수 있다. 판다스에서 가장 많이 사용되는 객체이며, 실제 파이썬을 활용한 데이터 분석을 하고 싶다면 필수적으로 알아야 하는 내용이다. 기본적으로 Python은 행렬 연산에 최적화된 언어라고 할 수 있지만, 판다스 라이브러리는 R의 데이터프레임에서 유래했다고 알려져 있다. 

[그림 1-1] 엑셀의 테이블 예시


여기서 잠깐! 초급자 또는 입문자들이 가장 궁금해하는 것 중의 하나가 R과 Python에 대한 비교가 아닐까 싶다. 통계/컴공 비전공자인 필자가 경험적으로 말씀 드리면 프로그래밍 기초가 전혀 없는 분들 중, 엑셀보다 빠른 데이터 전처리와 간단한 그래프를 그리는 것이 주목적이라면 여전히 R의 데이터프레임은 강력한 무기다. 간단하게 비교를 하자면, R의 대부분은 패키지는 데이터프레임이 기본 객체라고 봐도 무방하다. 그러나 파이썬은 웹개발이 주 언어이기 때문에 쉽게 접근하기가 힘들다. 인덱스, 딕셔너리, 행렬 등 매우 다양한 객체가 존재하기 때문에 이에 대한 인식은 알고서 출발해야 한다. 이 부분 때문에 조금 힘들고 난해할 수 있다. 그러나 데이터를 활용하여 프로그램을 개발하고 싶다면 이 때에는 Python이 가장 강력한 무기가 될 수 있다.


다시 본론으로 돌아오면, 아래 그림에서 설명하는 것처럼, 여러개의 시리즈들이 한데 모여서 데이터프레임을 이루는 구조가 데이터프레임이라고 할 수 있다.  

[그림 1-2] 시리즈와 데이터프레임 구조

시리즈가 모여서 데이터프레임이 만들어진다고 보면 더 좋을 듯 하다. 이 때, 데이터프레임의 열은 각각 시리즈의 객체이다. 우선, 판다스를 활용하여 간단하게 데이터프레임을 만들어 본다.


1. 딕셔너리에서 데이터프레임으로의 변환

딕셔너리에서 데이터프레임으로 변환하도록 한다. 아래 샘플코드를 확인해보자. 

dic_data = {'country': ['벨기에', '인도', '브라질'], 
        'capital': ['브뤼셀', '뉴델리', '브라질리아'], 
        'population': [11190846, 1303171035, 207847528]}

df = pd.DataFrame(dic_data)
print(df)
  country capital  population
0     벨기에     브뤼셀    11190846
1      인도     뉴델리  1303171035
2     브라질   브라질리아   207847528

'country', 'capital', 'population'은 열이름과 관련이 있는 것을 볼 수가 있다. 또한 자동적으로 행 인덱스가 0부터 생성됨을 볼수가 있다.

2. 시리즈에서 데이터프레임으로의 변환

이번에는 시리즈에서 데이터프레임으로 변환한다. 아래 샘플코드를 확인해보자.

series = {'one': pd.Series([1., 2., 3.], index=['a', 'b', 'c']), 
          'two': pd.Series([1., 2., 3., 4.], index=['a', 'b', 'c', 'd'])}

df = pd.DataFrame(series)
print(df)
   one  two
a  1.0  1.0
b  2.0  2.0
c  3.0  3.0
d  NaN  4.0

한가지 특이점은 각 컬럼마다 값이 달라도 에러가 발생하지는 않고, 다만 NaN이 작성되는 것을 볼 수가 있다.

3. ndArrays & Lists에서 데이터프레임으로의 변환

파이썬은 행렬과 리스트로 작성되는 코드가 많다. ndArrays에서 데이터프레임으로 변환 시, 특정 열(=column)에 결측치가 있으면 에러가 반환된다. 먼저 정상적인 코드를 확인한다.

ndArrays = {'one': [1., 2., 3., 4.], 
            'two': [4., 3., 2., 1.]}

pd.DataFrame(ndArrays)
   one  two
0  1.0  4.0
1  2.0  3.0
2  3.0  2.0
3  4.0  1.0

다음은 결측치가 발생한 코드를 확인한다. 아래코드에서 보는 것처럼 ValueError: arrays must all be same length 에러가 발생하는 것을 확인할 수 있다. (실제 에러코드가 발생하는지 확인해본다!)

ndArrays = {'one': [1., 2., 3., 4.], 
            'two': [4., 3., 2.]}

pd.DataFrame(ndArrays)

[그림 1-3] ndArrays에서 데이터프레임 변환 에러 발생 예시

위 코드에서 알 수 있는 것처럼, 딕셔너리 또는 시리즈 객체에서 데이터프레임으로 변환하는 경우 NaN을 반환하지만 데이터프레임으로 변환이 가능했다. 그러나 ndArrays의 경우 데이터프레임 객체 생성이 되지 않기 때문에, 데이터프레임으로 변환할 경우, 해당 객체가 ndArrays인지 우선 확인이 필요하다. 


다음 시간에는 생성된 데이터프레임에서 행과 열을 추출, 삭제, 추가와 관련된 내용을 담을 예정이다. 

Intro

MongoDB is a NoSQL database program using JSON type of documents with schemas. It’s open source cross-platform database. MongoDB is the representative NoSQL database engine. To me, I’ve started to learn Python for some reasons. One of them, for me, is that I want to insert webCrawling datasets including text data, image url, and so on. to NoSQL database.

MongDB Installation

I highly recommend users to use mongoDB atlas. Since Cloud rapidly dominates over IT industry, it’s better to practice a good cloud product like mongodb atlas cloud. It’s free to use it connecting to major cloud service agencies, AWS, GCP, Azure. The details are followed link: https://www.mongodb.com/cloud/atlas

Note - Network Access

Following instructions, it’s not much difficult to build mongoDB cluster. But, when setting Network Access up, it’s a bit confused where to click. For educational purpose please click ALLOW ACCESS FROM ANYWHERE for your sake.

By clicking, users are freely access to mongoDB in cloud.

Python Connecting to MongoDB Cluster

Many ways to connect in different languages. Here, fortunately, for python users, this platform provides sample code.

Now, it’s time to code in python.

Python module Installation

In Python, type below code and install on terminal.

$ pip install pymongo
$ pip install dnspython
$ pip install motor

If using python3, then use pip3 instead of pip

The details are explained at https://pypi.org/project/pymongo/

Via pymongo.MongoClient("your_uri"), users are able to reach mongoDB.

Error Handling 1 - dnspython

To me, the most difficult one was dealing with dnspython. When facing with the error dnspython, then please find solution Driver Compatibility

Erros Handling - Python Error Certificate Verify Failed

When trying to execute get data with query, then Certificate Verify Failed message may pop up. Then kindly visit How To Fix Python Error Certificate Verify Failed: Unable To Get Local Issuer Certificate In Mac OS

import pymongo
import dns
import pprint
import motor

url_path = "mongodb+srv://<user>:<password>@tafuncluster-rmc7j.gcp.mongodb.net/test?retryWrites=true&w=majority"
client = pymongo.MongoClient(url_path)
db = client['sample_dataset_R']
collection = db['iris']

pprint.pprint(collection.find_one())
{'Petal_Length': 1.4,
 'Petal_Width': 0.2,
 'Sepal_Length': 5.1,
 'Sepal_Width': 3.5,
 'Species': 'setosa',
 '_id': ObjectId('5db94dbfe6188c5426265283')}

From MongoDB to Pandas

The major work of data scientist or data analyst is to get data as DataFrame not JSON type. So, this is another important to convert JSON to DataFrame using Pandas. Let's try sample code below. Let's print again.

pprint.pprint(collection.find_one())
{'Petal_Length': 1.4,
 'Petal_Width': 0.2,
 'Sepal_Length': 5.1,
 'Sepal_Width': 3.5,
 'Species': 'setosa',
 '_id': ObjectId('5db94dbfe6188c5426265283')}

At this moment, we don't need to get _id. So, we will exclude the column.

import pandas as pd

exclude_column = {'_id': False} 
mong_data = list(collection.find({}, projection=exclude_column)) 
iris = pd.DataFrame(mong_data)
print(iris)
     Sepal_Length  Sepal_Width  Petal_Length  Petal_Width    Species
0             5.1          3.5           1.4          0.2     setosa
1             4.9          3.0           1.4          0.2     setosa
2             4.7          3.2           1.3          0.2     setosa
3             4.6          3.1           1.5          0.2     setosa
4             5.0          3.6           1.4          0.2     setosa
..            ...          ...           ...          ...        ...
595           6.7          3.0           5.2          2.3  virginica
596           6.3          2.5           5.0          1.9  virginica
597           6.5          3.0           5.2          2.0  virginica
598           6.2          3.4           5.4          2.3  virginica
599           5.9          3.0           5.1          1.8  virginica

[600 rows x 5 columns]
  • why we need list? After the command line, mong_data is stored in json format

  • From JSON format, we can converting json to pandas dataframe.

Creating Database and Collection

MongoDB will create very quickly and automatically if it does not exist, and make a connection to it. Let's create a database called my1stdatabase

import pymongo
my1stdatabase = client['my1stdatabase']
my1stcollection = my1stdatabase['my1stcollection']

This two line codes are big enough creating database and collection

Insert iris data into Collection

To insert data into Collection, it's not quite difficult to do it. We will use iris data already imported.

my1stcollection.insert_many(iris.to_dict('records'))
<pymongo.results.InsertManyResult at 0x116afc280>

Instead of iris, my1stcollection named is shown at mongodb cloud.

Conclusion

In this post, you have learnt that you can set up a mongoDB server very quickly, and that mongoDB is a breeze!

I like Cloud. Cloud is very powerful when working with others. As Data Scientist, building infrastructure is indeed horrible. Although docker is powerful, but it frustrates me when needed to study network, bridge, etc concepts. So, I gave up. I turned my goal to find a good solution related with cloud, and I found mongodb cloud. Yes, still needs to study more about MongoDB. For sure, I am able to be a big fan of mongoDB which is able to import and export unstructured data like img url, text data, etc with relational data.


I wanted to stick to a simple example, and I’m sure that it will already be very useful to you. In future posts, we’ll see how to access the server from a remote machine, and how to fill and read the database asynchronously, for an interactive display with bokeh.


For R Users, Please click my another post [http://rpubs.com/Evan_Jung/r_mongodb]

Chapter5_Case_Study

ALL CONTENTS ARE FROM DATACAMP

you'll apply all of the data cleaning techniques you've learned in this course towards tidying a real-world, messy dataset obtained from the Gapminder Foundation. Once you're done, not only will you have a clean and tidy dataset, you'll also be ready to start working on your own data science projects using the power of Python!

Chapter 1. Exploratory analysis

Whenever you obtain a new dataset, your first task should always be to do some exploratory analysis to get a better understanding of the data and diagnose it for any potential issues.

The Gapminder data for the 19th century has been loaded into a DataFrame called g1800s. In the IPython Shell, use pandas methods such as .head(), .info(), and .describe(), and DataFrame attributes like .columns and .shape to explore it.

In [91]:
import pandas as pd
url = 'https://assets.datacamp.com/production/course_2023/datasets/gapminder.csv'
gapminder = pd.read_csv(url, index_col=0)
print(gapminder.info())
<class 'pandas.core.frame.DataFrame'>
Int64Index: 780 entries, 0 to 259
Columns: 218 entries, 1800 to Life expectancy
dtypes: float64(217), object(1)
memory usage: 1.3+ MB
None
In [92]:
print(gapminder.head())
    1800   1801   1802   1803   1804   1805   1806   1807   1808   1809  \
0    NaN    NaN    NaN    NaN    NaN    NaN    NaN    NaN    NaN    NaN   
1  28.21  28.20  28.19  28.18  28.17  28.16  28.15  28.14  28.13  28.12   
2    NaN    NaN    NaN    NaN    NaN    NaN    NaN    NaN    NaN    NaN   
3  35.40  35.40  35.40  35.40  35.40  35.40  35.40  35.40  35.40  35.40   
4  28.82  28.82  28.82  28.82  28.82  28.82  28.82  28.82  28.82  28.82   

           ...            2008  2009  2010  2011  2012  2013  2014  2015  \
0          ...             NaN   NaN   NaN   NaN   NaN   NaN   NaN   NaN   
1          ...             NaN   NaN   NaN   NaN   NaN   NaN   NaN   NaN   
2          ...             NaN   NaN   NaN   NaN   NaN   NaN   NaN   NaN   
3          ...             NaN   NaN   NaN   NaN   NaN   NaN   NaN   NaN   
4          ...             NaN   NaN   NaN   NaN   NaN   NaN   NaN   NaN   

   2016        Life expectancy  
0   NaN               Abkhazia  
1   NaN            Afghanistan  
2   NaN  Akrotiri and Dhekelia  
3   NaN                Albania  
4   NaN                Algeria  

[5 rows x 218 columns]

Chapter 2. Visualizing your data

Since 1800, life expectancy around the globe has been steadily going up. You would expect the Gapminder data to confirm this.

The DataFrame g1800s has been pre-loaded. Your job in this exercise is to create a scatter plot with life expectancy in '1800' on the x-axis and life expectancy in '1899' on the y-axis.

Here, the goal is to visually check the data for insights as well as errors. When looking at the plot, pay attention to whether the scatter plot takes the form of a diagonal line, and which points fall below or above the diagonal line. This will inform how life expectancy in 1899 changed (or did not change) compared to 1800 for different countries. If points fall on a diagonal line, it means that life expectancy remained the same!

In [93]:
# Import matplotlib.pyplot
import matplotlib.pyplot as plt
In [94]:
# Create the scatter plot
gapminder.plot(kind='scatter', x='1800', y='1899')

# Specify axis labels
plt.xlabel('Life Expectancy by Country in 1800')
plt.ylabel('Life Expectancy by Country in 1899')

# Specify axis limits
plt.xlim(20, 55)
plt.ylim(20, 55)

# Display the plot
plt.show()

Excellent work! As you can see, there are a surprising number of countries that fall on the diagonal line. In fact, examining the DataFrame reveals that the life expectancy for 140 of the 260 countries did not change at all in the 19th century! This is possibly a result of not having access to the data for all the years back then. In this way, visualizing your data can help you uncover insights as well as diagnose it for errors.

Chapter 3. Thinking about the question at hand

Since you are given life expectancy level data by country and year, you could ask questions about how much the average life expectancy changes over each year.

Before continuing, however, it's important to make sure that the following assumptions about the data are true:

  • 'Life expectancy' is the first column (index 0) of the DataFrame.
  • The other columns contain either null or numeric values.
  • The numeric values are all greater than or equal to 0.
  • There is only one instance of each country.

You can write a function that you can apply over the entire DataFrame to verify some of these assumptions. Note that spending the time to write such a script will help you when working with other datasets as well.

In [95]:
import pandas as pd

def check_null_or_valid(row_data):
    """Function that takes a row of data,
    drops all missing values,
    and checks if all remaining values are greater than or equal to 0
    """
    no_na = row_data.dropna()
    numeric = pd.to_numeric(no_na)
    ge0 = numeric >= 0
    return ge0
In [96]:
# Check whether the last column is 'Life expectancy'
assert gapminder.columns[217] == 'Life expectancy'
In [97]:
# Check whether the values in the row are valid
assert gapminder.iloc[:, 0:216].apply(check_null_or_valid, axis=1).all().all()
In [98]:
# Check that there is only one instance of each country
assert gapminder['Life expectancy'].value_counts()[0] == 1
---------------------------------------------------------------------------
AssertionError                            Traceback (most recent call last)
<ipython-input-98-5d9f300af706> in <module>
      1 # Check that there is only one instance of each country
----> 2 assert gapminder['Life expectancy'].value_counts()[0] == 1

AssertionError: 
In [99]:
# If got error then please check
print(gapminder['Life expectancy'].value_counts()[0])
3

Getting into the habit of testing your code like this is an important skill.

Chapter 4. DisAssembling & Assembling your data

Here, three DataFrames have been pre-loaded: g1800s, g1900s, and g2000s. These contain the Gapminder life expectancy data for, respectively, the 19th century, the 20th century, and the 21st century.

Your task in this exercise is to concatenate them into a single DataFrame called gapminder. This is a row-wise concatenation, similar to how you concatenated the monthly Uber datasets in Chapter 3.

In [104]:
cols = ['Life expectancy'] + list(gapminder.loc[:,'1800':'1899'])
g1800s = gapminder.loc[:, cols]
print(g1800s.columns)
Index(['Life expectancy', '1800', '1801', '1802', '1803', '1804', '1805',
       '1806', '1807', '1808',
       ...
       '1890', '1891', '1892', '1893', '1894', '1895', '1896', '1897', '1898',
       '1899'],
      dtype='object', length=101)
In [105]:
cols = ['Life expectancy'] + list(gapminder.loc[:,'1900':'1999'])
g1900s = gapminder.loc[:, cols]
print(g1900s.columns)
Index(['Life expectancy', '1900', '1901', '1902', '1903', '1904', '1905',
       '1906', '1907', '1908',
       ...
       '1990', '1991', '1992', '1993', '1994', '1995', '1996', '1997', '1998',
       '1999'],
      dtype='object', length=101)
In [106]:
cols = ['Life expectancy'] + list(gapminder.loc[:,'2000':'2016'])
g2000s = gapminder.loc[:, cols]
print(g2000s.columns)
Index(['Life expectancy', '2000', '2001', '2002', '2003', '2004', '2005',
       '2006', '2007', '2008', '2009', '2010', '2011', '2012', '2013', '2014',
       '2015', '2016'],
      dtype='object')
In [107]:
# Concatenate the DataFrames row-wise
gapminder2 = pd.concat([g1800s, g1900s, g2000s])

# Print the shape of gapminder
print(gapminder2.shape)
(2340, 218)
/anaconda3/lib/python3.7/site-packages/ipykernel_launcher.py:2: FutureWarning: Sorting because non-concatenation axis is not aligned. A future version
of pandas will change to not sort by default.

To accept the future behavior, pass 'sort=False'.

To retain the current behavior and silence the warning, pass 'sort=True'.

  
In [108]:
# Print the head of gapminder
print(gapminder2.head())
    1800   1801   1802   1803   1804   1805   1806   1807   1808   1809  \
0    NaN    NaN    NaN    NaN    NaN    NaN    NaN    NaN    NaN    NaN   
1  28.21  28.20  28.19  28.18  28.17  28.16  28.15  28.14  28.13  28.12   
2    NaN    NaN    NaN    NaN    NaN    NaN    NaN    NaN    NaN    NaN   
3  35.40  35.40  35.40  35.40  35.40  35.40  35.40  35.40  35.40  35.40   
4  28.82  28.82  28.82  28.82  28.82  28.82  28.82  28.82  28.82  28.82   

           ...            2008  2009  2010  2011  2012  2013  2014  2015  \
0          ...             NaN   NaN   NaN   NaN   NaN   NaN   NaN   NaN   
1          ...             NaN   NaN   NaN   NaN   NaN   NaN   NaN   NaN   
2          ...             NaN   NaN   NaN   NaN   NaN   NaN   NaN   NaN   
3          ...             NaN   NaN   NaN   NaN   NaN   NaN   NaN   NaN   
4          ...             NaN   NaN   NaN   NaN   NaN   NaN   NaN   NaN   

   2016        Life expectancy  
0   NaN               Abkhazia  
1   NaN            Afghanistan  
2   NaN  Akrotiri and Dhekelia  
3   NaN                Albania  
4   NaN                Algeria  

[5 rows x 218 columns]

All the Gapminder data, from 1800 to 2016, is now contained in one DataFrame.

Chapter 5. Reshaping your data

Now that you have all the data combined into a single DataFrame, the next step is to reshape it into a tidy data format.

Currently, the gapminder DataFrame has a separate column for each year. What you want instead is a single column that contains the year, and a single column that represents the average life expectancy for each year and country. By having year in its own column, you can use it as a predictor variable in a later analysis.

You can convert the DataFrame into the desired tidy format by melting it.

In [109]:
import pandas as pd

# Melt gapminder: gapminder_melt
gapminder_melt = pd.melt(gapminder, id_vars = 'Life expectancy')
In [110]:
# Rename the columns
gapminder_melt.columns = ['country', 'year', 'life_expectancy']
In [111]:
# Print the head of gapminder_melt
print(gapminder_melt.head())
                 country  year  life_expectancy
0               Abkhazia  1800              NaN
1            Afghanistan  1800            28.21
2  Akrotiri and Dhekelia  1800              NaN
3                Albania  1800            35.40
4                Algeria  1800            28.82

Chapter 6. Checking the data types

Now that your data are in the proper shape, you need to ensure that the columns are of the proper data type. That is, you need to ensure that country is of type object, year is of type int64, and life_expectancy is of type float64.

The tidy DataFrame has been pre-loaded as gapminder. Explore it in the IPython Shell using the .info() method. Notice that the column 'year' is of type object. This is incorrect, so you'll need to use the pd.to_numeric() function to convert it to a numeric data type.

NumPy and pandas have been pre-imported as np and pd.

In [114]:
# Convert the year column to numeric
gapminder = gapminder_melt
gapminder.year = pd.to_numeric(gapminder.year)
In [116]:
# Test if country is of type object
import numpy as np
assert gapminder.country.dtypes == np.object
In [117]:
# Test if year is of type int64
assert gapminder.year.dtypes == np.int64
In [118]:
# Test if life_expectancy is of type float64
assert gapminder.life_expectancy.dtypes == np.float64

Excellent work! Since the assert statements did not throw any errors, you can be sure that your columns have the correct data types!

Chapter 7. Looking at country spellings

Having tidied your DataFrame and checked the data types, your next task in the data cleaning process is to look at the 'country' column to see if there are any special or invalid characters you may need to deal with.

It is reasonable to assume that country names will contain:

  • The set of lower and upper case letters.
  • Whitespace between words.
  • Periods for any abbreviations.

To confirm that this is the case, you can leverage the power of regular expressions again. For common operations like this, Pandas has a built-in string method - str.contains() - which takes a regular expression pattern, and applies it to the Series, returning True if there is a match, and False otherwise.

Since here you want to find the values that do not match, you have to invert the boolean, which can be done using ~. This Boolean series can then be used to get the Series of countries that have invalid names.

In [119]:
# Create the series of countries: countries
countries = gapminder['country']

# Drop all the duplicates from countries
countries = countries.drop_duplicates()

# Write the regular expression: pattern
pattern = '^[A-Za-z\.\s]*$'

# Create the Boolean vector: mask
mask = countries.str.contains(pattern)

# Invert the mask: mask_inverse
mask_inverse = ~mask

# Subset countries using mask_inverse: invalid_countries
invalid_countries = countries.loc[mask_inverse]

# Print invalid_countries
print(invalid_countries)
49            Congo, Dem. Rep.
50                 Congo, Rep.
53               Cote d'Ivoire
73      Falkland Is (Malvinas)
93               Guinea-Bissau
98            Hong Kong, China
118    United Korea (former)\n
131               Macao, China
132             Macedonia, FYR
145      Micronesia, Fed. Sts.
161            Ngorno-Karabakh
187             St. Barthélemy
193     St.-Pierre-et-Miquelon
225                Timor-Leste
251      Virgin Islands (U.S.)
252       North Yemen (former)
253       South Yemen (former)
258                      Åland
Name: country, dtype: object

As you can see, not all these country names are actually invalid so maybe the assumptions need to be tweaked a little. However, there certainly are a few cases worth further investigation, such as St. Barth?lemy. Whenever you are dealing with columns of raw data consisting of strings, it is important to check them for consistency like this.

Chapter 8. More data cleaning and processing

It's now time to deal with the missing data. There are several strategies for this: You can drop them, fill them in using the mean of the column or row that the missing value is in (also known as imputation), or, if you are dealing with time series data, use a forward fill or backward fill, in which you replace missing values in a column with the most recent known value in the column. See pandas Foundations for more on forward fill and backward fill.

In general, it is not the best idea to drop missing values, because in doing so you may end up throwing away useful information. In this data, the missing values refer to years where no estimate for life expectancy is available for a given country. You could fill in, or guess what these life expectancies could be by looking at the average life expectancies for other countries in that year, for example. Whichever strategy you go with, it is important to carefully consider all options and understand how they will affect your data.

In this exercise, you'll practice dropping missing values. Your job is to drop all the rows that have NaN in the life_expectancy column. Before doing so, it would be valuable to use assert statements to confirm that year and country do not have any missing values.

Begin by printing the shape of gapminder in the IPython Shell prior to dropping the missing values. Complete the exercise to find out what its shape will be after dropping the missing values!

In [120]:
# Assert that country does not contain any missing values
assert pd.notnull(gapminder.country).all()
In [121]:
# Assert that year does not contain any missing values
assert pd.notnull(gapminder.year).all()
In [122]:
# Drop the missing values
gapminder = gapminder.dropna(how='any')

# Print the shape of gapminder
print(gapminder.shape)
(43857, 3)

After dropping the missing values from 'life_expectancy', the number of rows in the DataFrame has gone down from 169260 to 43857. In general, you should avoid dropping too much of your data, but if there is no reasonable way to fill in or impute missing values, then dropping the missing data may be the best solution.

Chapter 9. Wrapping up

Now that you have a clean and tidy dataset, you can do a bit of visualization and aggregation. In this exercise, you'll begin by creating a histogram of the life_expectancy column. You should not get any values under 0 and you should see something reasonable on the higher end of the life_expectancy age range.

Your next task is to investigate how average life expectancy changed over the years. To do this, you need to subset the data by each year, get the life_expectancy column from each subset, and take an average of the values. You can achieve this using the .groupby() method. This .groupby() method is covered in greater depth in Manipulating DataFrames with pandas.

Finally, you can save your tidy and summarized DataFrame to a file using the .to_csv() method.

matplotlib.pyplot and pandas have been pre-imported as plt and pd. Go for it!

In [123]:
# Add first subplot
plt.subplot(2, 1, 1) 
Out[123]:
<matplotlib.axes._subplots.AxesSubplot at 0x1195bc780>
In [124]:
# Create a histogram of life_expectancy
gapminder.life_expectancy.plot(kind='hist')
Out[124]:
<matplotlib.axes._subplots.AxesSubplot at 0x11d0a2978>
In [125]:
# Group gapminder: gapminder_agg
gapminder_agg = gapminder.groupby('year')['life_expectancy'].mean()
In [126]:
# Print the head of gapminder_agg
print(gapminder_agg.head())
year
1800    31.486020
1801    31.448905
1802    31.463483
1803    31.377413
1804    31.446318
Name: life_expectancy, dtype: float64
In [127]:
# Print the tail of gapminder_agg
print(gapminder_agg.tail())
year
2012    71.663077
2013    71.916106
2014    72.088125
2015    72.321010
2016    72.556635
Name: life_expectancy, dtype: float64
In [128]:
# Add second subplot
plt.subplot(2, 1, 2)
Out[128]:
<matplotlib.axes._subplots.AxesSubplot at 0x11ab18a20>
In [129]:
# Create a line plot of life expectancy per year
gapminder_agg.plot()
Out[129]:
<matplotlib.axes._subplots.AxesSubplot at 0x1086d77b8>
In [130]:
# Add title and specify axis labels
plt.title('Life expectancy over the years')
plt.ylabel('Life expectancy')
plt.xlabel('Year')
Out[130]:
Text(0.5, 0, 'Year')
In [131]:
# Display the plots
plt.tight_layout()
plt.show()
<Figure size 432x288 with 0 Axes>
In [132]:
# Save both DataFrames to csv files
gapminder.to_csv('gapminder.csv')
gapminder_agg.to_csv('gapminder_agg.csv')

You've stepped through each stage of the data cleaning process and your data is now ready for serious analysis! Looking at the line plot, it seems like life expectancy has, as expected, increased over the years. There is a surprising dip around 1920 that may be worth further investigation!

+ Recent posts